
Coding Challenge #2: API Health Monitor

The Scenario
Your microservices are talking to 15 different APIs, and one of them just went down during peak traffic. Your monitoring dashboard is showing red, but which API is the culprit? And how long has it been failing?
You need a quick way to check the health of multiple endpoints and get actionable data about response times and availability.
Your Mission
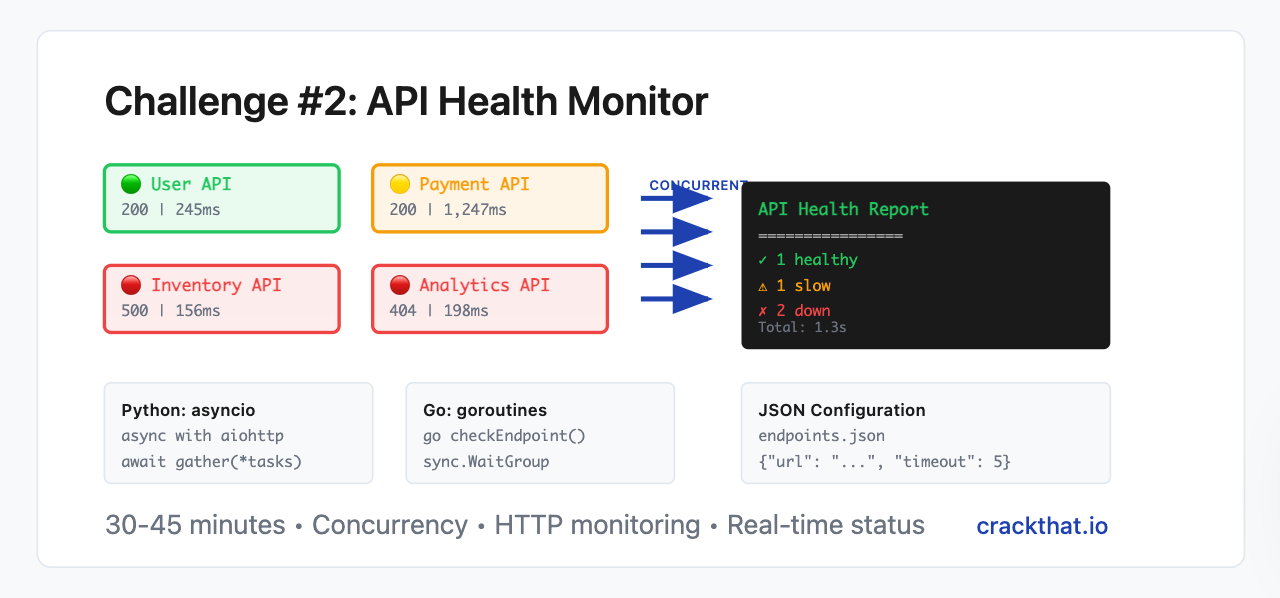
Build a concurrent API health checker that monitors multiple endpoints and reports their status in real-time.
Requirements
Your tool must:
Read endpoint configuration from a JSON file
Check all endpoints concurrently (not sequentially!)
Measure response times accurately
Categorize endpoints: HEALTHY, SLOW, DOWN, ERROR
Handle timeouts gracefully (don't wait forever)
Generate a clean status report
Exit with appropriate codes for automation
Configuration File (endpoints.json)
{
  "endpoints": [
    {
      "name": "User API",
      "url": "https://jsonplaceholder.typicode.com/users/1",
      "timeout": 5
    },
    {
      "name": "Payment Gateway",
      "url": "https://httpstat.us/200?sleep=1000",
      "timeout": 3
    },
    {
      "name": "Inventory Service",
      "url": "https://httpstat.us/500",
      "timeout": 5
    },
    {
      "name": "Analytics API",
      "url": "https://httpstat.us/404",
      "timeout": 2
    }
  ],
  "thresholds": {
    "slow_response_ms": 1000,
    "timeout_seconds": 5
  }
}
Expected Output
API Health Check Report - 2025-07-19 14:30:15
============================================

🟢 HEALTHY: User API
   └─ https://jsonplaceholder.typicode.com/users/1
   └─ Status: 200 | Response: 245ms

🟡 SLOW: Payment Gateway
   └─ https://httpstat.us/200?sleep=1000
   └─ Status: 200 | Response: 1,247ms (exceeds 1000ms threshold)

🔴 DOWN: Inventory Service
   └─ https://httpstat.us/500
   └─ Status: 500 | Response: 156ms

🔴 ERROR: Analytics API
   └─ https://httpstat.us/404
   └─ Status: 404 | Response: 198ms

============================================
Summary: 1 healthy, 1 slow, 2 down
Total check time: 1.3 seconds (concurrent execution)
Exit code: 2 (critical issues detected)
Starter Code Templates
Python Solution
import json
import asyncio
import aiohttp
import time
from datetime import datetime
import sys

async def check_endpoint(session, endpoint, thresholds):
    """Check a single endpoint and return health status"""
    name = endpoint['name']
    url = endpoint['url']
    timeout = endpoint.get('timeout', 5)

    try:
        start_time = time.time()

        async with session.get(url, timeout=aiohttp.ClientTimeout(total=timeout)) as response:
            response_time = (time.time() - start_time) * 1000  # Convert to ms

            # Your logic here to determine status
            # Return status dict with name, url, status_code, response_time, health

    except asyncio.TimeoutError:
        # Handle timeout
        pass
    except Exception as e:
        # Handle other errors
        pass

async def check_all_endpoints(config):
    """Check all endpoints concurrently"""
    endpoints = config['endpoints']
    thresholds = config['thresholds']

    async with aiohttp.ClientSession() as session:
        # Create tasks for concurrent execution
        tasks = [check_endpoint(session, endpoint, thresholds) for endpoint in endpoints]

        # Wait for all tasks to complete
        results = await asyncio.gather(*tasks)

    return results

def load_config(filename):
    """Load configuration from JSON file"""
    # Your implementation here
    pass

def generate_report(results):
    """Generate and print the health report"""
    # Your implementation here
    pass

if __name__ == "__main__":
    if len(sys.argv) != 2:
        print("Usage: python api_health.py <config.json>")
        sys.exit(1)

    # Load config and run checks
    config = load_config(sys.argv[1])
    results = asyncio.run(check_all_endpoints(config))
    generate_report(results)
Go Solution
package main

import (
    "context"
    "encoding/json"
    "fmt"
    "net/http"
    "os"
    "sync"
    "time"
)

type Endpoint struct {
    Name    string `json:"name"`
    URL     string `json:"url"`
    Timeout int    `json:"timeout"`
}

type Config struct {
    Endpoints  []Endpoint `json:"endpoints"`
    Thresholds struct {
        SlowResponseMs int `json:"slow_response_ms"`
        TimeoutSeconds int `json:"timeout_seconds"`
    } `json:"thresholds"`
}

type Result struct {
    Name         string
    URL          string
    StatusCode   int
    ResponseTime time.Duration
    Health       string
    Error        error
}

func checkEndpoint(endpoint Endpoint, thresholds Config, results chan<- Result) {
    client := &http.Client{
        Timeout: time.Duration(endpoint.Timeout) * time.Second,
    }

    start := time.Now()

    // Your implementation here
    // Make HTTP request, measure time, determine health status
    // Send result to channel
}

func loadConfig(filename string) (*Config, error) {
    // Your implementation here
    return nil, nil
}

func generateReport(results []Result) {
    // Your implementation here
}

func main() {
    if len(os.Args) != 2 {
        fmt.Println("Usage: go run api_health.go <config.json>")
        os.Exit(1)
    }

    config, err := loadConfig(os.Args[1])
    if err != nil {
        fmt.Printf("Error loading config: %v\n", err)
        os.Exit(1)
    }

    // Create channel for results
    results := make(chan Result, len(config.Endpoints))

    // Start goroutines for concurrent checking
    var wg sync.WaitGroup
    for _, endpoint := range config.Endpoints {
        wg.Add(1)
        go func(ep Endpoint) {
            defer wg.Done()
            checkEndpoint(ep, *config, results)
        }(endpoint)
    }

    wg.Wait()
    close(results)

    // Collect results and generate report
    var allResults []Result
    for result := range results {
        allResults = append(allResults, result)
    }

    generateReport(allResults)
}
Test Your Solution
Quick Test with Real APIs:
{
  "endpoints": [
    {
      "name": "Google",
      "url": "https://www.google.com",
      "timeout": 5
    },
    {
      "name": "GitHub API",
      "url": "https://api.github.com",
      "timeout": 3
    },
    {
      "name": "Fake Slow API",
      "url": "https://httpstat.us/200?sleep=2000",
      "timeout": 5
    }
  ],
  "thresholds": {
    "slow_response_ms": 1000,
    "timeout_seconds": 5
  }
}
Health Status Logic
HEALTHY: 2xx status + response time < slow_response_ms threshold
SLOW: 2xx status + response time ≥ slow_response_ms threshold
DOWN: 5xx status codes
ERROR: 4xx status codes, timeouts, or connection failures
Bonus Challenges
Add retry logic for failed requests
Support custom HTTP headers in config
Generate JSON output format
Add email/Slack notifications for failures
Track uptime percentage over time
Support HTTP methods other than GET
Why This Challenge Matters
API monitoring is crucial for:
Incident response: Quickly identify failing services
Performance optimization: Find slow endpoints
SLA compliance: Track availability metrics
Automation: Integrate into CI/CD pipelines
Alerting: Notify teams of issues
This challenge teaches:
Concurrent programming (async/await, goroutines)
HTTP client programming
Error handling and timeouts
JSON configuration parsing
Performance measurement
Status reporting and exit codes
