
Coding Challenge #3: CSV Data Aggregator

Your sales team just dumped 3 months of transaction data into a CSV file with 10,000+ rows. The VP of Sales wants answers by EOD: "What's our top-selling product category? Which region is underperforming? What's our average deal size?"
Manually scrolling through Excel isn't going to cut it. You need a tool that can crunch the numbers fast and give you actionable insights.
Your Mission
Build a CSV data processor that reads sales data, calculates meaningful aggregations, and generates summary statistics that help drive business decisions.
Requirements
Your tool must:
Read CSV files with sales transaction data
Calculate total revenue by product category
Find top-selling products by quantity and revenue
Compute average, median, and standard deviation of deal sizes
Identify best and worst performing sales regions
Handle missing data gracefully (empty fields, malformed rows)
Generate both console output and JSON export
Process files efficiently (handle 10k+ rows without issues)
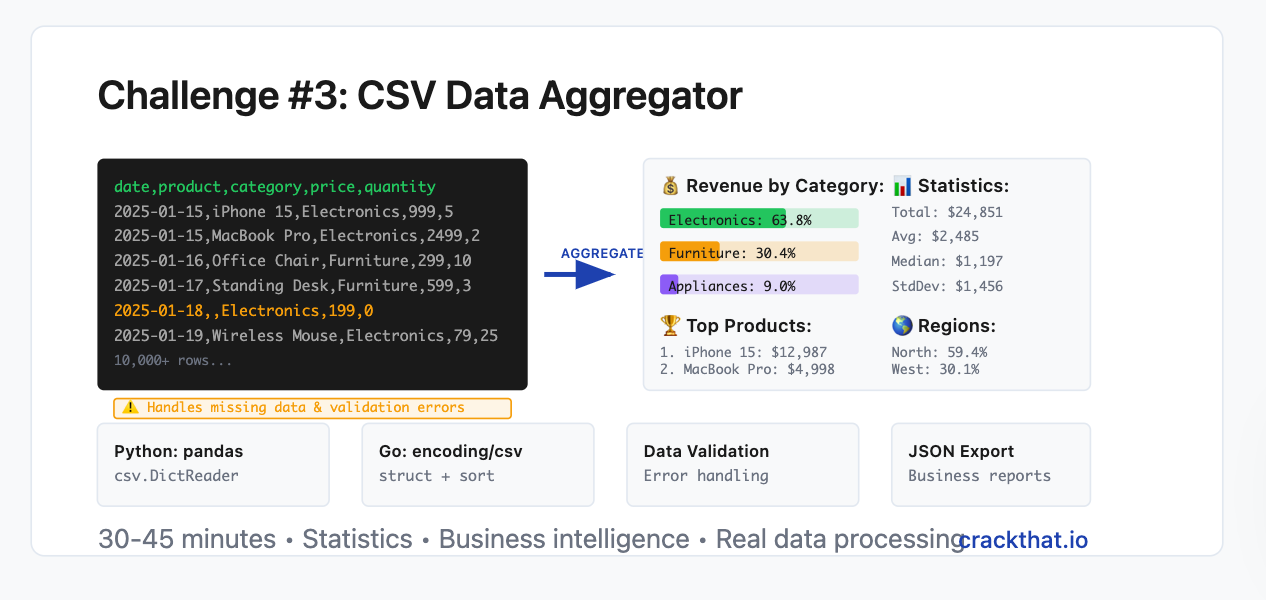
Sample Input (sales_data.csv)
date,product,category,price,quantity,region,salesperson
2025-01-15,iPhone 15,Electronics,999.00,5,North,Alice Johnson
2025-01-15,MacBook Pro,Electronics,2499.00,2,West,Bob Smith
2025-01-16,Office Chair,Furniture,299.00,10,South,Carol Davis
2025-01-16,Standing Desk,Furniture,599.00,3,East,David Wilson
2025-01-17,iPhone 15,Electronics,999.00,8,North,Alice Johnson
2025-01-17,Coffee Maker,Appliances,149.00,15,West,Eva Brown
2025-01-18,Wireless Mouse,Electronics,79.00,25,South,Frank Miller
2025-01-18,Ergonomic Keyboard,Electronics,159.00,12,East,Grace Lee
2025-01-19,Table Lamp,Furniture,89.00,20,North,Alice Johnson
2025-01-19,,Electronics,199.00,0,West,Bob Smith
Expected Output
Sales Data Analysis Report
==========================
📊 Dataset Overview:
- Total transactions: 10
- Date range: 2025-01-15 to 2025-01-19
- Unique products: 8
- Total revenue: $24,851.00

💰 Revenue by Category:
-----------------------
Electronics: $15,849.00 (63.8%)
Furniture:   $7,567.00 (30.4%)
Appliances:  $2,235.00 (9.0%)

🏆 Top Products by Revenue:
---------------------------
1. MacBook Pro: $4,998.00 (2 units)
2. iPhone 15: $12,987.00 (13 units)
3. Standing Desk: $1,797.00 (3 units)

📈 Deal Size Statistics:
------------------------
Average: $2,485.10
Median: $1,197.00
Std Dev: $1,456.33
Range: $89.00 - $4,998.00

🌎 Regional Performance:
------------------------
North: $14,765.00 (59.4%) - 28 units
West:  $7,483.00 (30.1%) - 17 units
South: $3,771.00 (15.2%) - 35 units
East:  $2,697.00 (10.9%) - 15 units

⚠️  Data Quality Issues:
------------------------
- 1 row with missing product name
- 1 transaction with 0 quantity

💾 Report exported to: sales_analysis_2025-07-19.json
Want the complete solution with optimized algorithms and advanced features? Upgrade to paid subscription for detailed implementations in both Python and Go.
